The stock market soared throughout the Roaring Twenties. In August 1921, the Dow Jones Industrial Average was 63. By September 3, 1929, the Dow had risen to 381, an increase of more than 600%.
And then it crashed.
In March 1929, a small stock crash occurred as investors started to sell off stocks, exposing some cracks in the market’s value. Then, from June to September, the market gained 20%. On September 3, 1929, the Dow closed at a record high of 381.
Later in September, there were selloffs. Prices bobbed and weaved. There were several days of big losses. But three particular days are generally labeled as the Great Crash:
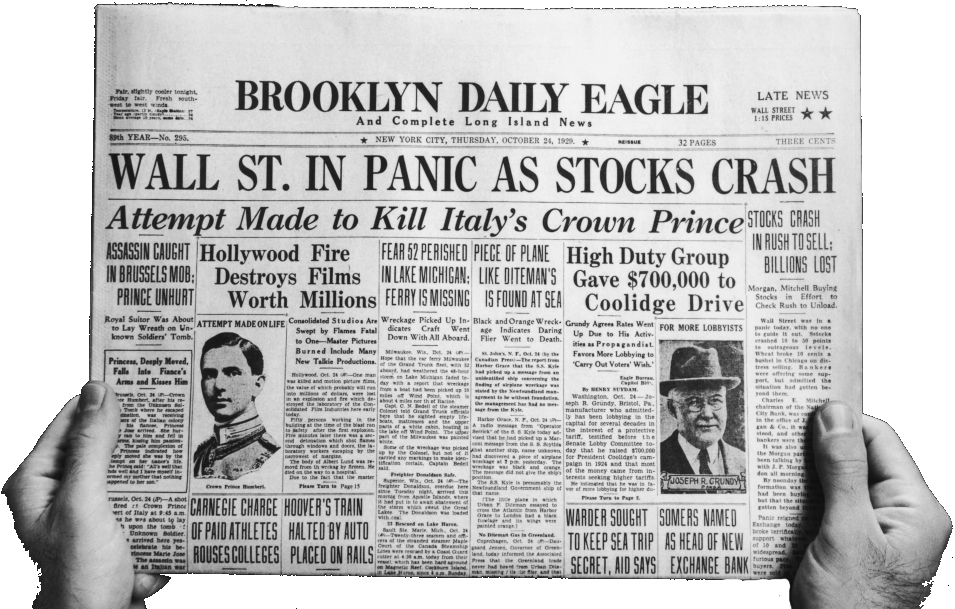
Black Thursday – October 24

When the markets opened, people began selling, and selling more. Trading grew frantic. Ticker tapes were behind as much as 90 minutes. Phone calls got busy signals. Crowds gathered outside the NYSE trying to get information. Police were called. It was not yet noon on October 24.
By closing, the Dow had dropped 9%.
Black Monday – October 28
On Black Monday, investors faced margin calls. They owed more than the stocks were worth. They lost everything. The Dow declined nearly 13%.
Black Tuesday – October 29
On Black Tuesday, the market dropped nearly 12%. Billions of dollars were lost, wiping out thousands of investors. The next day, panic selling reached its peak with some stocks having no buyers at any price.
The slide continued…
By mid-November, the Dow had dropped almost 50%.
Surprisingly, the largest losses in the market didn’t happen during 1929, but through the next three years. By summer 1932, stocks had lost almost 90% of their value. The Dow was at 41, its lowest value ever.

Causes
Experts and pundits blamed many things for the Great Crash. Among those were oversupply of goods, poor agricultural markets, declining construction, and margin stock trading. More blame was assigned to low wages, high debt, and large bank loans that could not be repaid.
Another cause is mentioned, that of public utility holding companies. By 1929, thousands of electricity companies had been consolidated into holding companies, many of which were owned by higher-level holding companies.
Public Utility Holding Companies
In September 1929, public utility companies comprised 18% of the value of shares on the NYSE. In October 1929, the government announced that public utility holding companies would be regulated. Prices plummeted as fear and uncertainty caused people to dump their utility stocks.
During the month, twenty-nine public utilities (tabulated by the New York Times) lost $5.1 billion, by far the largest loss of any of the industries listed by the Times.
Nathan Jones’ companies weren’t traded on NYSE
Jones’ companies stock prices weren’t traded on the public stock exchange, so they didn’t crash. But they were in the same industry, so Jones’ companies found it harder to find new investors. And Jones’ investment department found it increasingly difficult to sell shares of other publicly traded utilities.
Jones’ companies continued on…

In the face of the stock market crash, Jones’ companies continued to pay dividends. The companies increased advertising, touting safety and security.

Here’s an ad that ran just three weeks after the Great Crash. It promises that Public Utility Investment Company only deals in securities based on actual earnings.
The company touts its steady past performance.
Meanwhile, acquisitions continued at a breakneck pace.

Another new office
The company had outgrown its new 1927 office space. In 1929 it built a new building in downtown Salina with 1/2 block frontage. The “front office” departments moved into the new office, while the accounting and “back office” functions remained in the old office.

But there were pressures
Investors were reluctant to buy stock in public utility holding companies. There was increasing regulation of utilities. Acquisitions were becoming more competitive. There was pressure to lower rates.
A boom or a crash?

Would the Public Utility Investment Company and its empire continue to thrive and grow? Or would it succumb to the Great Depression?
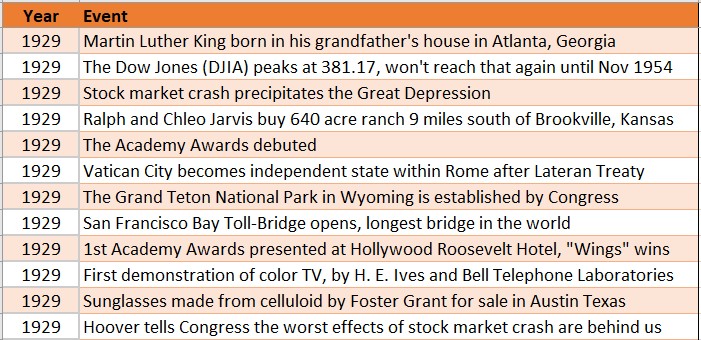
Timeline – 1929
Sources
- Newspaper headline – Wall Street in Panic – Brooklyn Daily Eagle – Stock Market Crash of 1929 – History.com – https://www.history.com/topics/great-depression/1929-stock-market-crash
- Graph – Stock prices during Great Crash – Stock Market Crash of 1929 Facts, Causes, and Impact – The Balance – https://www.thebalance.com/stock-market-crash-of-1929-causes-effects-and-facts-3305891
- Newspaper articles – newspapers.com
- Photo – new Public Utility Investment Company office – The Parade – November 1930 – Jarvis Family Documents – Chleo Webb Jarvis collection
- Photo – 118 West Iron Avenue, Salina, Kansas – Google Maps 2021
- Image – business graph with arrows – AM Online – https://www.am-online.com/news/market-insight/2019/07/05/car-finance-volumes-fall-in-may-as-registrations-dip
- Image – graph of stock prices 1929-1932 – Dow Jones – 1929 Crash and Bear Market – macrotrends – https://www.macrotrends.net/2484/dow-jones-crash-1929-bear-market
